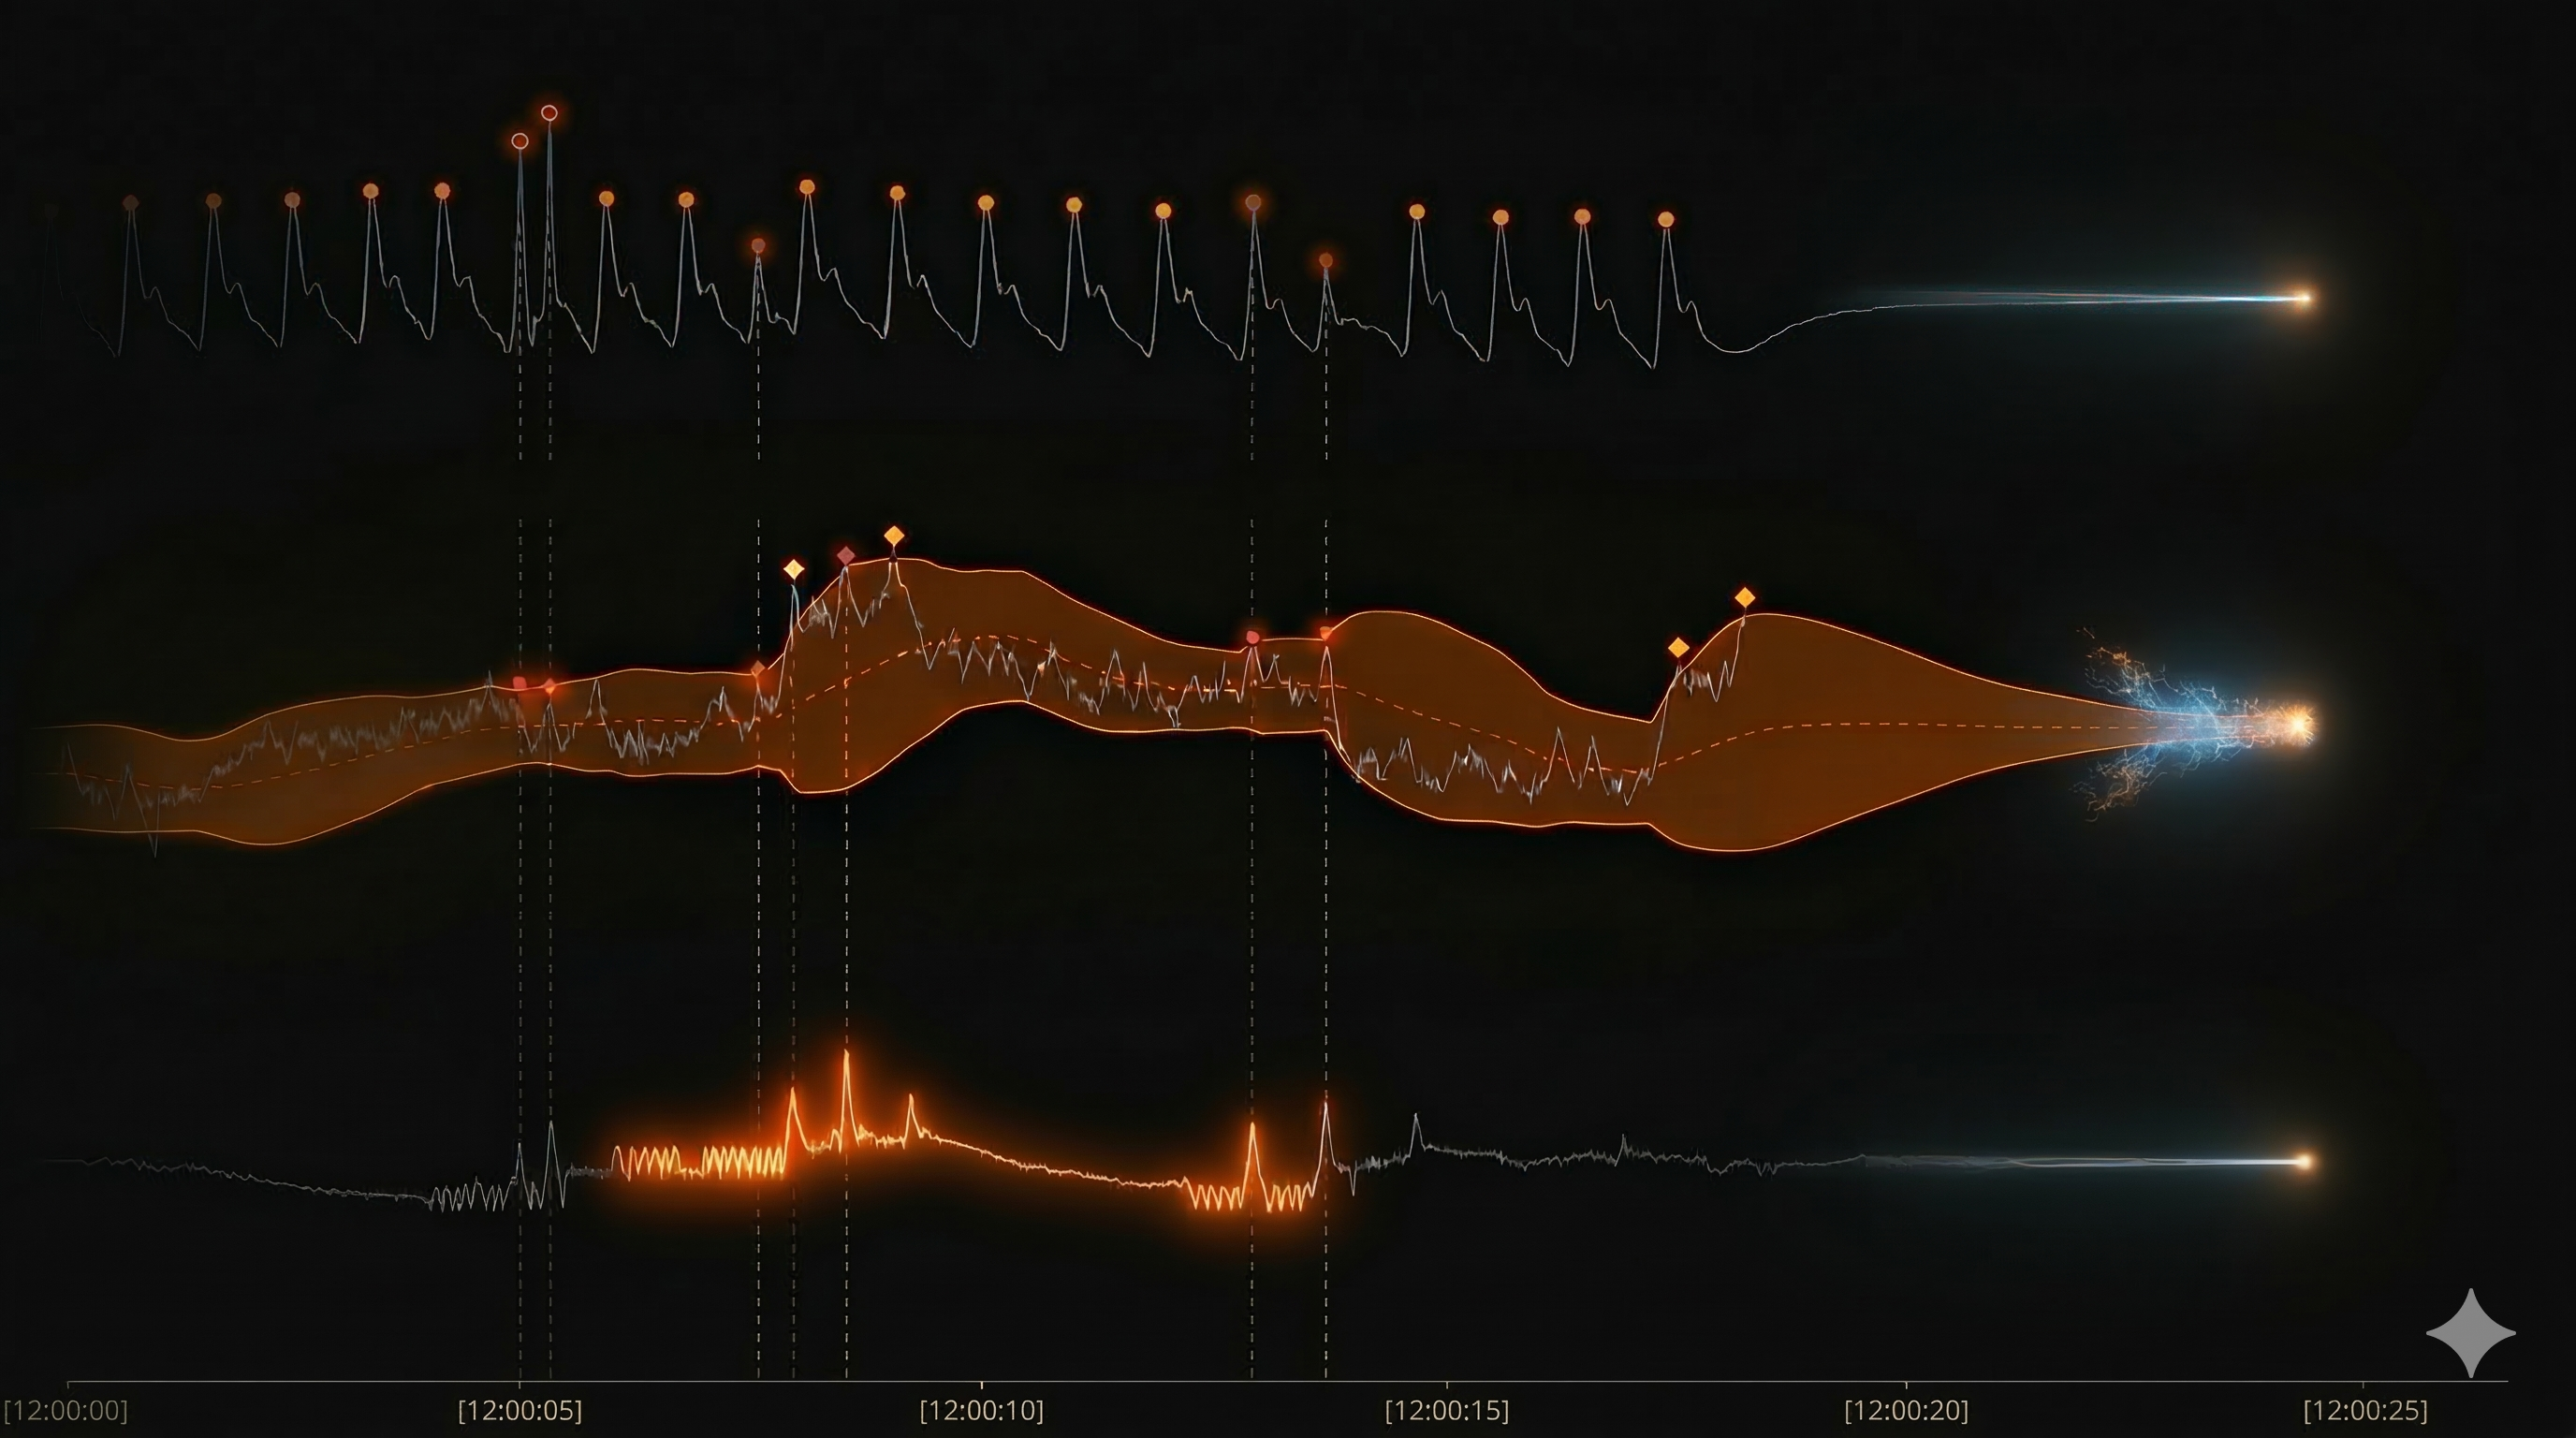
Years ago, I had to build a program to detect local peaks in real time as data flows in. The task sounds simple: consume a continuous numerical time series and produce an event whenever a local extreme appears in the signal. This pattern appears across many industries. In industrial environments, it may indicate a spike detected by a sensor. In finance, it can signal a turning point in the price of an asset. In networking, it might indicate abnormal traffic or even a potential attack. The goal was therefore to detect these peaks with the lowest possible latency as the data arrives.
Every industry and every type of event has its own signature. For instance, you must decide the size of the local neighborhood required to confidently tag the current point as a local extreme. Moreover, you may want to detect another local extreme close to the first one, because the relationship between them might have physical meaning as well. More generally, you may want to extract events or features from a signal in real time.
So how do you do that? You take domain-specific time series data, design an algorithm, and then backtest it: you send historical data through the algorithm to see whether it produces the expected results. You can define several metrics to evaluate the quality of the algorithm. Typically, this work begins in a notebook environment using a data-science-friendly language like Python, where the algorithm can be executed and visualized. You then plot the input data alongside the detected events to verify whether the results make sense. The job then becomes adjusting the parameters of the model—such as thresholds and window sizes—until they make sense for the specific type of signal you are processing.
The engineering friction
In this development process there are several problems that need to be addressed. First of all, you don't want to reinvent the wheel: if you are processing time series data, you want to rely on existing and powerful tools built for that purpose. One option might be MATLAB, R, or Python. However, these scientific computing environments, while excellent for prototyping and analysis, are often not ideal for production systems. They may lack guardrails, integrate poorly with the rest of the architecture, and they are typically more familiar to the data science team than to the rest of the software engineering team.
What usually happens is that the prototyped real-time event detection algorithm is rewritten in a “production-ready” language, typically the one used by the rest of the company's services. Depending on the performance requirements, this might be Java, Scala, Node.js, or sometimes Python itself.
This creates serious friction within an organization, someone eventually will have to deal with it. Should the data scientist translate the algorithm for the rest of the team, or should a backend developer do it? This rewrite is expensive because it involves translating complex logic from the data science environment into the production software stack.
What we were looking for
If we could find an open source project that:
- Uses the same code in prototyping as in production
- Provides building blocks that can be easily composed to create new algorithms
- Runs efficiently in resource-constrained environments, which rules out Python
- Detects, reacts to, or extracts events with the lowest possible latency, which strongly points toward C++ or Rust
- Automatically synchronizes streams when multiple inputs arrive at different rates, aligning them to the same logical time before computing
Then most of the friction points would be solved. We couldn't find such a project, and that is why we created RtBot.
RtBot and RtBot SQL
RtBot’s architecture is similar to TensorFlow, but for time series. It provides Python and JavaScript wrappers, while the core engine is implemented in C++. This brings similar benefits: you can design and test your real-time algorithm in a notebook environment without worrying that performance will suffer when it runs in production.
While the RtBot framework successfully addressed many of the pain points in the development cycle of these real-time programs, it later became clear that thinking in terms of graphs of operators can quickly become cumbersome. Our next goal was therefore to reduce the cognitive load required to create these algorithms.
We believed the best approach was to provide users with an API they were already familiar with, but with a slightly different interpretation. If real-time time series processing can be viewed as operations on tables evolving over time, then once the data is available historically the most natural interface becomes SQL. That led us to create RtBot SQL.
RtBot SQL does not aim to be a fully compatible SQL dialect. Instead, it provides a way to describe operations on input streams and to write programs that produce output streams. In a sense, we are intentionally leveraging users' familiarity with SQL to allow them to express otherwise complex real-time programs in a much simpler way.
For example, detecting pressure anomalies using Bollinger Bands looks like this:
-- pressure_stream(device_id, ts, pressure_psi)

CREATE MATERIALIZED VIEW bollinger AS
  SELECT device_id,
         ts,
         pressure_psi,
         MOVING_AVERAGE(pressure_psi, 20)                                  AS mid_band,
         MOVING_AVERAGE(pressure_psi, 20) + 2 * MOVING_STD(pressure_psi, 20) AS upper_band,
         MOVING_AVERAGE(pressure_psi, 20) - 2 * MOVING_STD(pressure_psi, 20) AS lower_band
  FROM pressure_stream;

CREATE MATERIALIZED VIEW pressure_alerts AS
  SELECT device_id,
         ts,
         pressure_psi,
         mid_band,
         upper_band,
         lower_band
  FROM bollinger
  WHERE pressure_psi > upper_band
     OR pressure_psi < lower_band;
This runs in real time, sample by sample, as data arrives. No batch jobs, no scheduled recomputation.
Results in production
We have been using RtBot in our Cool Guardian solution for HVAC monitoring, and the results have been remarkable. RtBot runs as a custom Redis module, allowing us to process all the data coming from HVAC systems in real time. We can easily write queries that detect when a system stabilizes after turning on—a condition required to compute superheat and subcooling metrics, which are critical indicators of the unit’s health—without performing any batch processing.
The footprint is extremely small: it’s a C++ engine running directly inside Redis. But the biggest impact has been on the team and the development cycle. Creating a new real-time algorithm is now a matter of writing a query in a notebook, validating it against historical data, and pushing it to Redis. One person can now accomplish what previously required coordination between data scientists and backend developers.
That reduction in coordination is where most of the economic value comes from. Maintaining and evolving our real-time algorithms is simply cheaper and significantly faster.
Our goal with RtBot is to bring these same benefits to other businesses. RtBot is not a replacement for Kafka, but for many companies it can enable real-time intelligence at a fraction of the cost and with a fraction of the human resources typically required. In other words, it lowers the barrier to extracting value from data in real time.
If you are ingesting time series and performing statistical analysis on them, we would love to talk. Reach out to the Katenaria team.