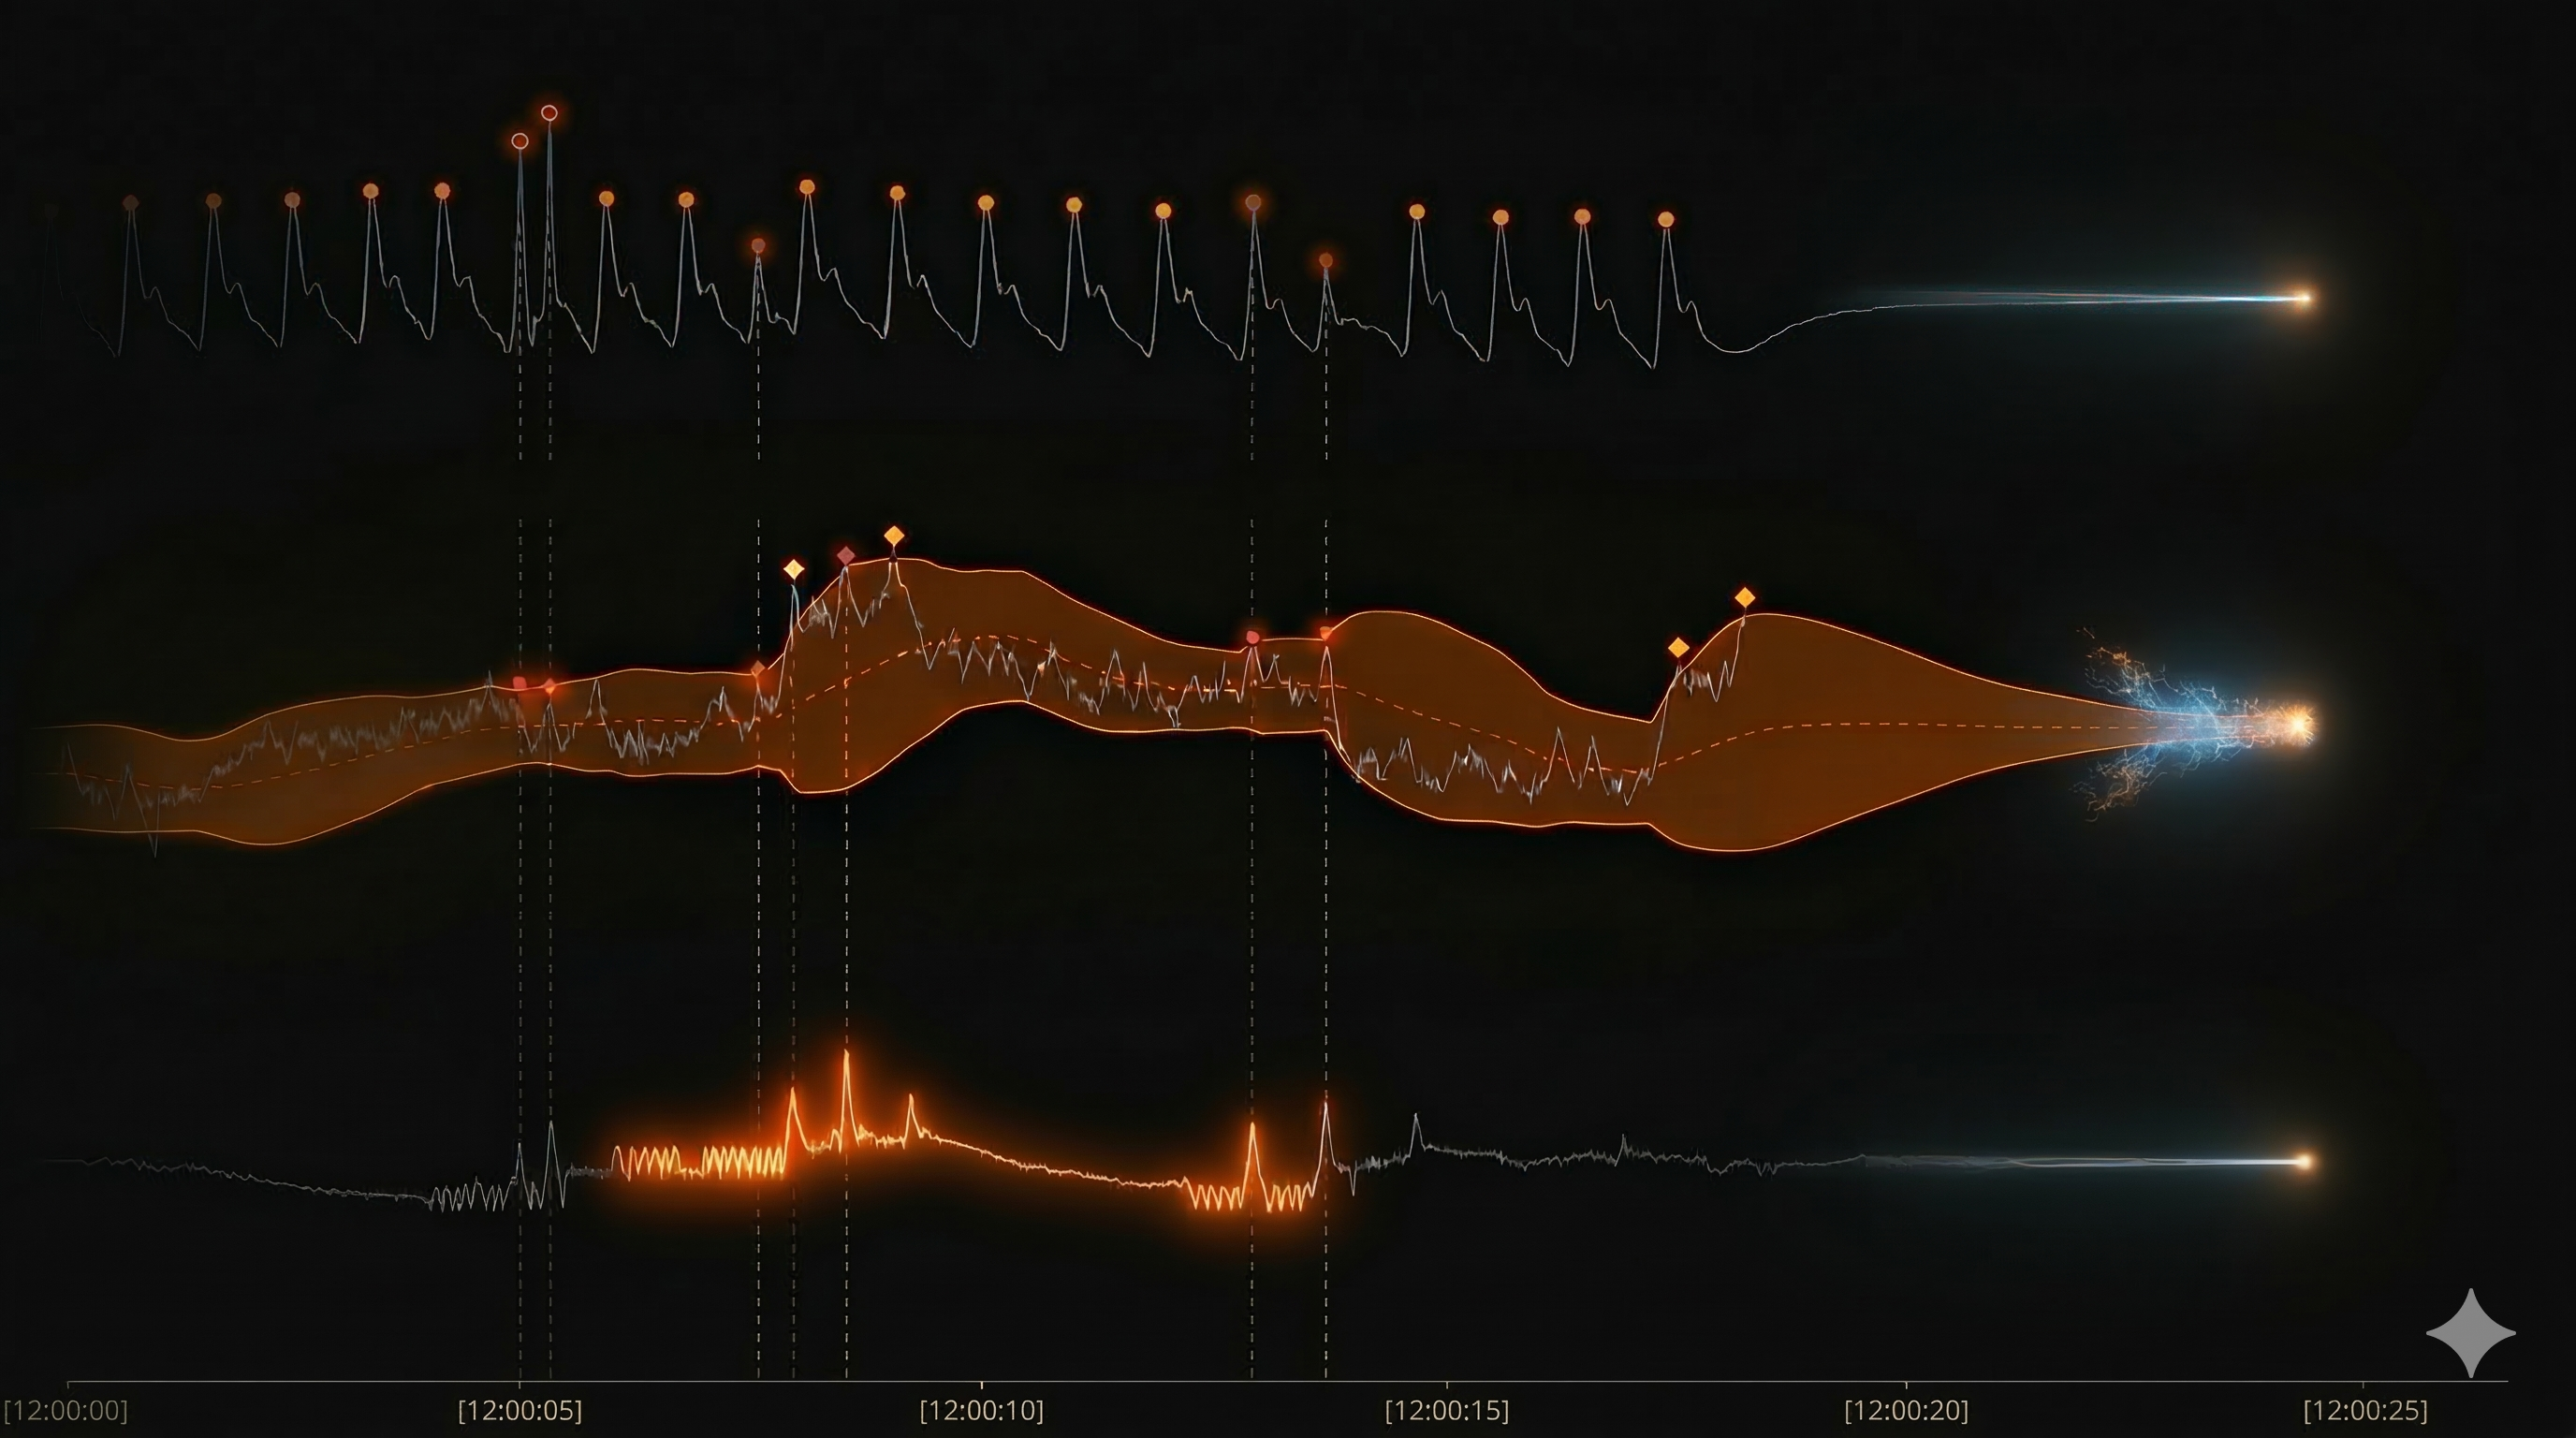
Years ago, I had to build a program to detect local peaks in real time as data flows in. The task sounds simple: consume a continuous numerical time series and produce an event whenever a local extreme appears in the signal. This pattern appears across many industries. In industrial environments, it may indicate a spike detected by a sensor. In finance, it can signal a turning point in the price of an asset. In networking, it might indicate abnormal traffic or even a potential attack. The goal was therefore to detect these peaks with the lowest possible latency as the data arrives.
Every industry and every type of event has its own signature. For instance, you must decide the size of the local neighborhood required to confidently tag the current point as a local extreme. Moreover, you may want to detect another local extreme close to the first one, because the relationship between them might have physical meaning as well. More generally, you may want to extract events or features from a signal in real time.